

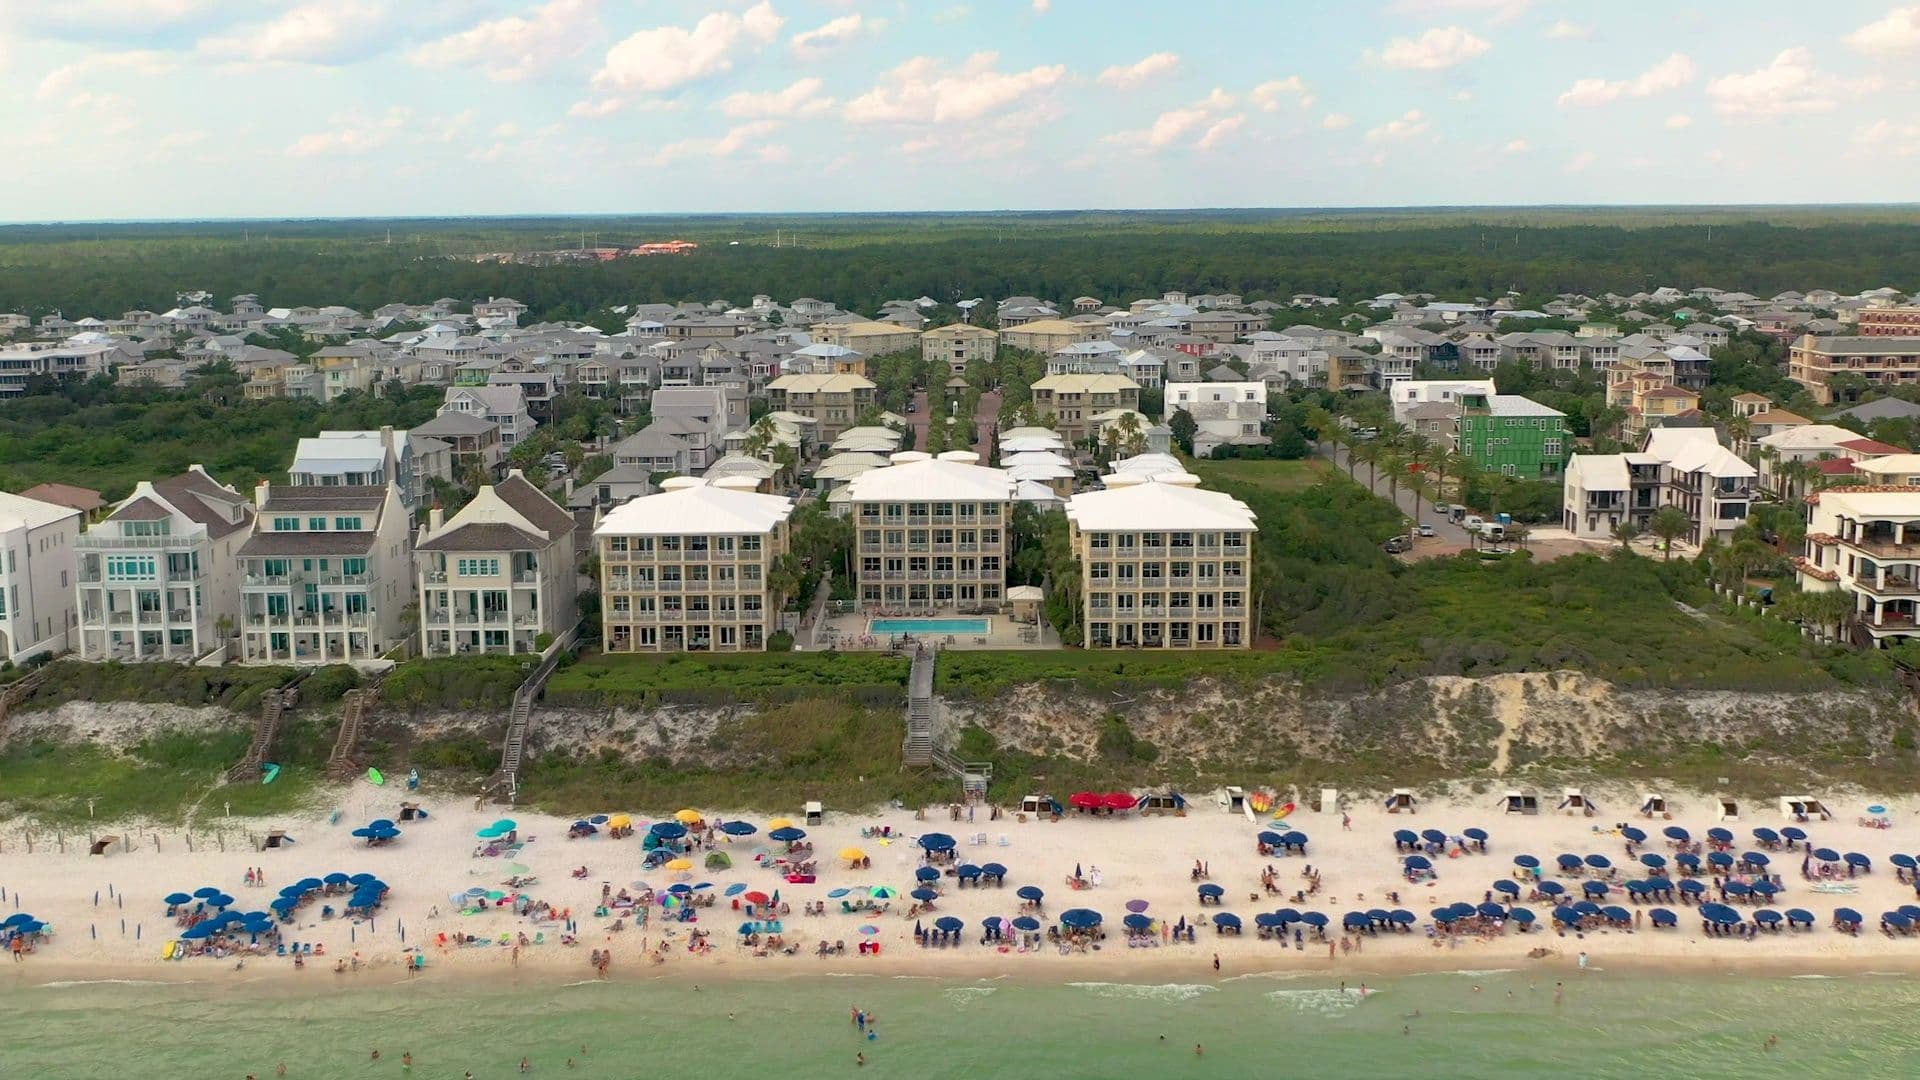
Homes for sale inSeacrest Beach
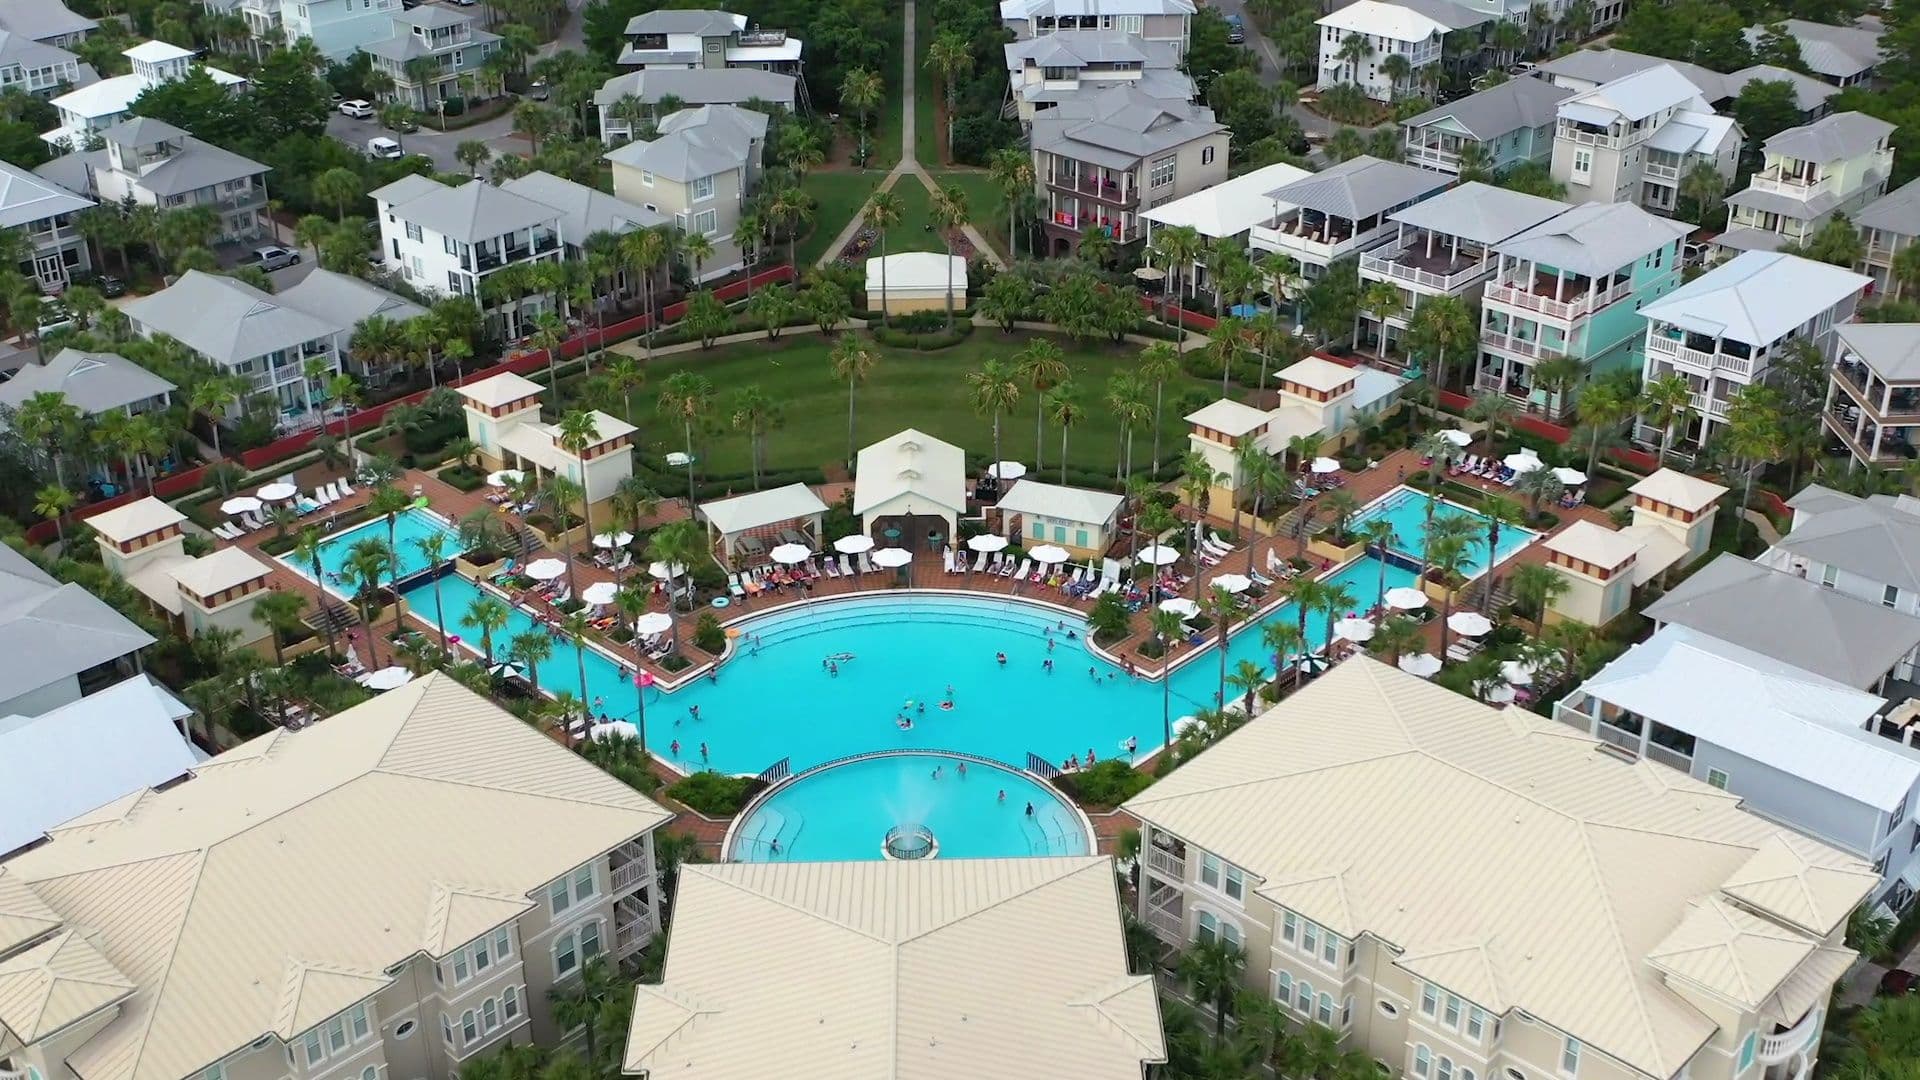
Beach town
Seacrest Beach
Seacrest Beach is one of the beach communities along Scenic Highway 30A in South Walton, Florida.
Ask Garett about Seacrest BeachFor sale
Homes for sale in Seacrest Beach
Living in Seacrest Beach
Seacrest Beach is one of the more mature communities on the east end. It started in 1996, the big lagoon pool and the first homes were finished in 2000, and today there are about 400 homes on 78 acres between Alys Beach and Rosemary Beach. It's a nice, settled neighborhood.
The pool is the centerpiece: about 12,000 square feet and open all year. The neighborhood sits on the north side of 30A, so you get to the beach on a boardwalk or a free tram across 30A to the deeded beach access. It's a big bike community, and you can walk or ride over to the Village of South Walton for shops and food, or down to Rosemary.
A lot of people like to rent here. Owners hire their own managers, and the association runs the guest rules: renters pre-register, everyone 8 and up wears a wristband, and cars need a pass. Since January 2022, only registered owners can drive golf carts or LSVs in the neighborhood, so renters and guests can't.
Here's what I'd tell an investor. A lot of the homes here are 20-plus years old and ready for updating. If you're willing to take on a remodel, there's an opportunity to pick something up and bring it back to how good it looked when it was new. No guarantees, but with how mature this neighborhood is, the timing is good. It's a more realistic place to do that than Seaside, where prices are higher and the review process is tougher.
Things to know before you buy
- Dues: listings have shown about $1,350 a quarter for a home.
- Carts: owners only, since January 1, 2022. Renters and guests can't drive carts here.
- Renters pre-register, everyone 8 and up wears a wristband, and cars need a pass. Cars without one get towed, and the owner can be fined $100 a day.
- Quiet hours run 10 p.m. to 7 a.m., the speed limit is 15 mph, and during spring and fall break weeks anyone 17 or under must be with an adult after 8 p.m.
- The beach is reached through the Sunset Beach community across 30A. The tram runs March through October, and bikes, wagons and pets aren't allowed on the walkway.
- There's no public beach parking here. The nearest public lots are at Inlet Beach.
- A design board reviews plans, so build that into any remodel.
- Lots are small, about a tenth of an acre, with alleys and rear garages.
Questions buyers ask
Can I rent my home short-term?
Yes. Most homes here rent, through managers the owners pick, under the association's guest rules.
Can I drive a golf cart?
Only if you're a registered owner. Renters and guests can't, since January 2022.
How do I get to the beach?
By boardwalk or the free tram across 30A to the deeded beach access.
What are the HOA dues?
Listings have shown about $1,350 a quarter for a home. I'll pull the exact figure for any home you're looking at.
Is the pool open all year?
Yes. The last 15 minutes of every hour are adults only.
What can I walk to?
The Village of South Walton's shops and restaurants next door, and Rosemary Beach is a short walk or bike ride away.
Is it a good place to remodel?
It can be. Many homes are 20-plus years old. The design board reviews plans, so ask about the process early.
Rules and fees last checked October 2026. They change, so confirm before you buy.
Looking at Seacrest Beach? Text or email me anytime, and I'll walk you through it.
Market stats
Seacrest Beach by the numbers
All of 30ASeacrest Beach homes sold for a median $678/sq ft in the last 12 months, 9% above 30A overall ($622/sq ft).
- Median price
- $1.54M
- Last 12 months
- Days to contract
- 99
- Median, last 12 months
- Of asking price
- 96%
- Median, last 12 months
Seacrest Beach homes sold for a median $1.65M in the 6 months to September 2026, 10% above all of 30A ($1.5M).
- Seacrest Beach
- All of 30A
The middle sale price. Gray: all of 30A. Each month pools its sales with the five months before; gaps had fewer than 10 sales.
- Homes for sale
- 38
- Now
- Median price: 8% above all of 30A ($1.43M).
- Days to contract: About as fast as all of 30A (98 days).
- Of asking price: About the same as all of 30A (96.2%).
- Homes for sale: 7.3 months of supply, a buyer's market.
1 of 3: Median price
Seacrest Beach homes sold for a median $1.65M in the 6 months to September 2026, 10% above all of 30A ($1.5M).
- Seacrest Beach
- All of 30A
The middle sale price. Gray: all of 30A. Each month pools its sales with the five months before; gaps had fewer than 10 sales.
Seacrest Beach homes sold for a median $686/sq ft in the 6 months to September 2026, 8% above all of 30A ($633/sq ft).
- Seacrest Beach
- All of 30A
Sale price divided by heated square feet. Gray: all of 30A. Each month pools its sales with the five months before; gaps had fewer than 10 sales.
Over the last 12 months, Seacrest Beach houses sold for a median $668/sq ft and condos $824/sq ft (all of 30A: houses $625/sq ft and condos $917/sq ft).
Median price per square foot by type of home, last 12 months. Types with fewer than 10 sales are left out.
Show the numbers
| Type | Sales | Median price | Price per sq ft | All of 30A, per sq ft |
|---|---|---|---|---|
| Houses | 47 | $1.65M | $668/sq ft | $625/sq ft |
| Condos | 15 | $915K | $824/sq ft | $917/sq ft |
1 of 3: Homes for sale
39 Seacrest Beach homes were for sale on September 15, 2026, 4% of all 30A's 993, 19% fewer than a year ago.
Homes for sale on the 15th of each month (not counting homes under contract).
In the 6 months to September 2026, Seacrest Beach had 7.3 months of supply, a buyer's market; all of 30A had 7.5.
- Seacrest Beach
- All of 30A
Homes for sale divided by the average homes sold per month over the past year. Under 4 months favors sellers; over 6 favors buyers. Gray: all of 30A. Each month pools its sales with the five months before; gaps had fewer than 10 sales.
58 homes sold in Seacrest Beach in 2025, against 139 in 2020 (4.6% of 30A's 1,262).
Homes sold each year (houses, condos and townhomes). * The year so far.
Show the numbers
| Year | Sales | Median price | Price per sq ft | Days to contract | Of asking price |
|---|---|---|---|---|---|
| 2017 | 82 | $725K | $347/sq ft | 136 | 95.6% |
| 2018 | 60 | $753K | $359/sq ft | 106 | 96.5% |
| 2019 | 71 | $728K | $356/sq ft | 101 | 96.1% |
| 2020 | 139 | $780K | $395/sq ft | 66 | 97.6% |
| 2021 | 130 | $1.19M | $591/sq ft | 9 | 98.6% |
| 2022 | 90 | $1.45M | $807/sq ft | 22 | 97.5% |
| 2023 | 41 | $1.49M | $760/sq ft | 73 | 94.9% |
| 2024 | 59 | $1.45M | $752/sq ft | 109 | 94.7% |
| 2025 | 58 | $1.37M | $692/sq ft | 136 | 94.6% |
| 2026 so far | 42 | $1.61M | $686/sq ft | 96 | 96.7% |
1 of 2: Days to contract
Seacrest Beach homes took a median 99 days to go under contract in the 6 months to September 2026; all of 30A took 80.
- Seacrest Beach
- All of 30A
Days from listing to an accepted contract, counting a relisting of the same home within 90 days as one stretch. Gray: all of 30A. Each month pools its sales with the five months before; gaps had fewer than 10 sales.
Seacrest Beach homes sold for a median 96.9% of their last asking price in the 6 months to September 2026; all of 30A 96.4%.
- Seacrest Beach
- All of 30A
Sale price as a share of the last asking price. Gray: all of 30A. Each month pools its sales with the five months before; gaps had fewer than 10 sales.
1 of 5: Price cuts
59% of the Seacrest Beach listings that left the market in 2025 had cut their price; all of 30A: 48%.
Listings that sold, expired or were taken off the market each year, and the share whose last asking price was below their first. Years with fewer than 10 are left blank.
Show the numbers
| Year off the market | Listings | Cut their price | Share | Typical cut |
|---|---|---|---|---|
| 2017 | 126 | 61 | 48.4% | 5.6% |
| 2018 | 114 | 50 | 43.9% | 3.8% |
| 2019 | 112 | 59 | 52.7% | 5.4% |
| 2020 | 182 | 62 | 34.1% | 3.5% |
| 2021 | 140 | 21 | 15.0% | 5.7% |
| 2022 | 109 | 36 | 33.0% | 6.2% |
| 2023 | 81 | 49 | 60.5% | 6.0% |
| 2024 | 127 | 74 | 58.3% | 6.1% |
| 2025 | 123 | 72 | 58.5% | 5.9% |
About half of the Seacrest Beach homes put on the market in 2024 hadn't sold a year later; all of 30A: 53%.
Homes put on the market each year that hadn't sold within 12 months (a home relisted the same year counts once). Years with fewer than 10 are left blank.
Show the numbers
| Year listed | Homes listed | Not sold within a year | Share |
|---|---|---|---|
| 2017 | 100 | 36 | 36.0% |
| 2018 | 115 | 56 | 48.7% |
| 2019 | 113 | 35 | 31.0% |
| 2020 | 127 | 12 | 9.4% |
| 2021 | 129 | 5 | 3.9% |
| 2022 | 111 | 22 | 19.8% |
| 2023 | 91 | 50 | 54.9% |
| 2024 | 111 | 61 | 55.0% |
84% of the Seacrest Beach resale homes listed in 2025 were vacation rentals when they came on the market; all of 30A: 49%.
Resale homes listed each year that the MLS lists as vacation rentals when they came on the market. Years with fewer than 10 are left blank.
Show the numbers
| Year listed | Resale listings | Vacation rentals | Share |
|---|---|---|---|
| 2017 | 103 | 64 | 62.1% |
| 2018 | 112 | 74 | 66.1% |
| 2019 | 120 | 85 | 70.8% |
| 2020 | 130 | 94 | 72.3% |
| 2021 | 134 | 103 | 76.9% |
| 2022 | 116 | 92 | 79.3% |
| 2023 | 91 | 69 | 75.8% |
| 2024 | 123 | 95 | 77.2% |
| 2025 | 109 | 91 | 83.5% |
Seacrest Beach homes listed in January went under contract fastest, a typical 35 days; across all of 30A, December listings were fastest (34 days).
Homes listed in each month since 2017 that later sold, all years together: the typical days to an accepted contract. Months with fewer than 10 sales are left blank.
Show the numbers
| Month listed | Sold | Typical days to contract | Of first asking price |
|---|---|---|---|
| January | 65 | 35 | 96.8% |
| February | 64 | 36 | 97.4% |
| March | 93 | 74 | 94.6% |
| April | 67 | 45 | 95.1% |
| May | 64 | 43 | 95.1% |
| June | 55 | 57 | 95.1% |
| July | 60 | 56 | 95.0% |
| August | 61 | 43 | 95.5% |
| September | 48 | 69 | 94.9% |
| October | 66 | 56 | 94.7% |
| November | 57 | 89 | 94.9% |
| December | 33 | 68 | 96.2% |
Seacrest Beach buyers from 2021–23 who paid $1M–$2M and have resold since came out −6.0% after selling costs; all of 30A at that price: −4.0%.
Homes bought between October 2021 and October 2023 and sold again since: the typical change from what the buyer paid, after about 7% in selling costs. Distress sales and rebuilt homes are left out; price bands with fewer than 10 resales are left blank.
Show the numbers
| Price paid | Buyers | Resold | Sold for more | Sold for less | After 7% selling costs |
|---|---|---|---|---|---|
| Under $1M | 34 | 6 | 4 | 2 | – |
| $1M-$2M | 93 | 27 | 15 | 10 | -6.0% |
| $2M-$3M | 26 | 6 | 3 | 3 | – |
| $3M-$4M | 2 | 0 | 0 | 0 | – |
| $4M-$5M | 0 | 0 | 0 | 0 | – |
| Over $5M | 0 | 0 | 0 | 0 | – |
From Garett's blog
Mountainfilm on Tour Returns to WaterColor Nov. 6 and 7
The 26th annual Mountainfilm on Tour screens outdoors at WaterColor Marina Park Amphitheater this Friday and Saturday, Nov. 6 and 7.
30A Homes Took About 109 Days to Sell Over the Last Six Months
From May 8 to November 3, 2026, homes and lots on 30A took 109 days on average to sell. Here's what that pace means for owners and buyers.
What's happening on 30A this week
A busy first week of November on 30A: a BBQ festival, a wine weekend in Seaside, outdoor films, an arts festival, a ranger hike and an early look at December.