

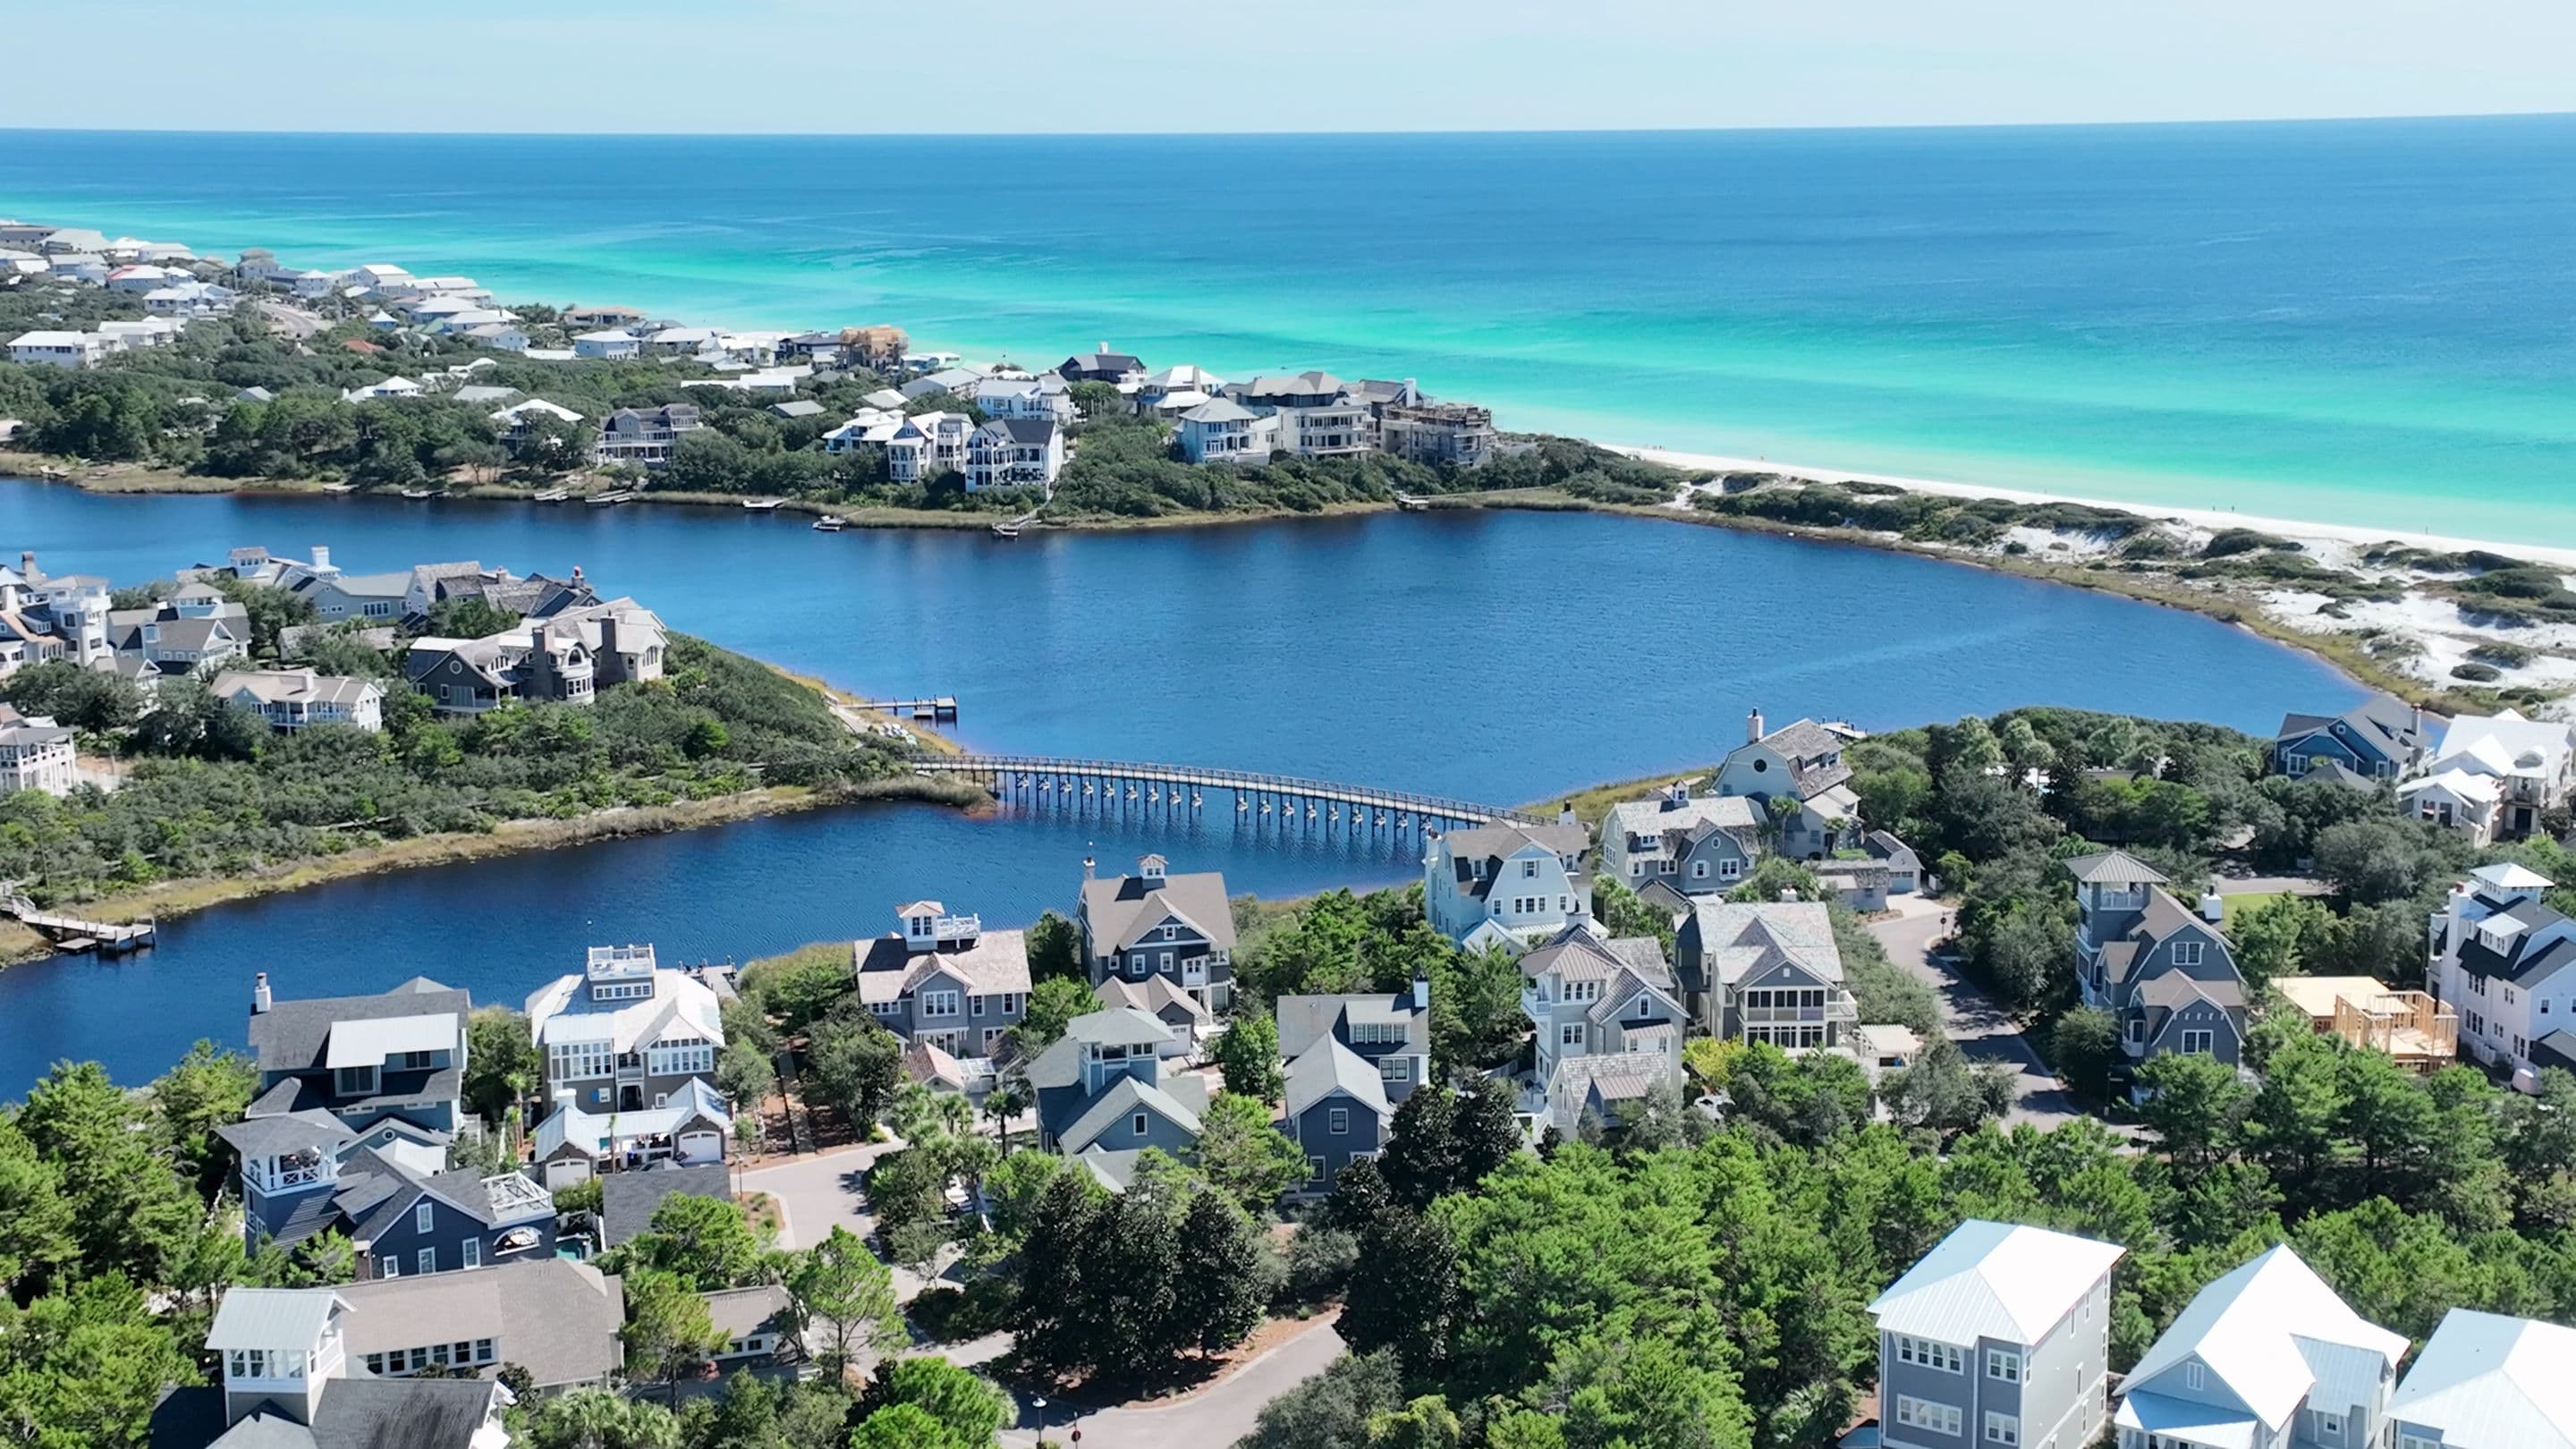
Homes for sale inEast 30A
Beach town
East 30A
East 30A is one of the beach communities along Scenic Highway 30A in South Walton, Florida.
Ask Garett about East 30AFor sale
Homes for sale on East 30A
Living on East 30A
To me, East 30A starts where Seagrove ends, at WaterSound West Beach, and runs all the way east to the Bay County line. That takes in WaterSound Beach, Kaiya, Alys Beach, Seacrest Beach, Rosemary Beach and Inlet Beach. Not all of Inlet Beach is on 30A, but its ZIP code runs from around Prominence to the county line, so I count it in.
The east end is the busier end of 30A. A lot of people vacation over here, there's more demand, and in season there are more people on this side than on the west end. It's also the pricier end. Alys Beach is the most expensive place on all of 30A, and Rosemary, Kaiya and WaterSound are near the top too. The exception is Inlet Beach, which is still one of the best values on 30A.
Most of the east end is planned towns, each with its own rules. Alys and Rosemary ban golf carts, Seacrest Beach allows them for owners only, and WaterSound and Kaiya each have a private club that doesn't come with the house. In between are smaller pockets: the Gulf-front condos and homes around Camp Creek Lake, Santimo Beach between Alys and Rosemary, and Prominence and GracePoint right next to WaterSound.
Over here you've got several little town centers to walk to: Rosemary's Main Street, Alys's Town Center, the Village of South Walton by Seacrest, and 30Avenue at US 98, with Publix up at Watersound Town Center. Nature is close too: Deer Lake State Park, Camp Creek Lake, Lake Powell (the biggest coastal dune lake in Florida) and Camp Helen State Park at the county line. And if you're flying in, the Panama City airport (ECP) is about 34 minutes from Inlet Beach without traffic.
Things to know before you buy
- Every community sets its own rules, and they change a lot from one to the next. Carts are banned in Alys and Rosemary, allowed for owners only in Seacrest Beach, and set by the community on WaterSound's private streets.
- The Watersound Club and the Kaiya Club are separate memberships. Buying a home doesn't make you a member.
- Most of the beach here is private. Public beach means Deer Lake State Park ($3 a car), a few small walk-ups between Camp Creek Lake and Alys, and the big Inlet Beach Regional Access, which has free parking.
- Most of the east end has Inlet Beach addresses (32461), even in WaterSound, Alys and Rosemary, so search sites often mix the towns together.
- It's busier in season than the west end, with more people on this side in summer.
- Dues and club costs run high in the planned towns. Get them in writing for the specific home.
Questions buyers ask
Where does East 30A start?
The way I see it, at WaterSound West Beach, where Seagrove ends, and it runs east to the Bay County line, Inlet Beach included.
Which towns are on East 30A?
WaterSound Beach, Kaiya, Alys Beach, Seacrest Beach, Rosemary Beach and Inlet Beach, plus smaller pockets like Prominence, GracePoint, Santimo Beach and the homes around Camp Creek Lake.
Is the east end more expensive than the west?
Generally, yes. Alys Beach is the priciest place on 30A. Inlet Beach is the exception and one of the best values.
Can I rent my home short-term?
In most places, yes, but each community has its own rules, and some, like Watersound Camp Creek inland, don't allow it. Check before you buy.
Can I drive a golf cart?
It depends on the community: not in Alys or Rosemary, owners only in Seacrest Beach, and county LSV rules on county roads.
Where's public beach parking?
The Inlet Beach Regional Access, Deer Lake State Park, and a few small walk-ups.
Which airport is closest?
Northwest Florida Beaches (ECP) in Panama City, about 34 minutes from Inlet Beach without traffic.
Rules and fees last checked October 2026. They change, so confirm before you buy.
Looking at the east end? Text or email me anytime, and I'll walk you through it.
Market stats
East 30A by the numbers
All of 30AEast 30A homes sold for a median $763/sq ft in the last 12 months, 23% above 30A overall ($622/sq ft).
- Median price
- $1.93M
- Last 12 months
- Days to contract
- 115
- Median, last 12 months
- Of asking price
- 94%
- Median, last 12 months
East 30A homes sold for a median $1.97M in the 6 months to September 2026, 31% above all of 30A ($1.5M).
- East 30A
- All of 30A
The middle sale price. Gray: all of 30A. Each month pools its sales with the five months before; gaps had fewer than 10 sales.
- Homes for sale
- 47
- Now
- Median price: 35% above all of 30A ($1.43M).
- Days to contract: Slower than all of 30A (98 days).
- Of asking price: Further under asking than all of 30A (96.2%).
- Homes for sale: 8.3 months of supply, a buyer's market.
1 of 3: Median price
East 30A homes sold for a median $1.97M in the 6 months to September 2026, 31% above all of 30A ($1.5M).
- East 30A
- All of 30A
The middle sale price. Gray: all of 30A. Each month pools its sales with the five months before; gaps had fewer than 10 sales.
East 30A homes sold for a median $790/sq ft in the 6 months to September 2026, 25% above all of 30A ($633/sq ft).
- East 30A
- All of 30A
Sale price divided by heated square feet. Gray: all of 30A. Each month pools its sales with the five months before; gaps had fewer than 10 sales.
Over the last 12 months, East 30A houses sold for a median $740/sq ft and condos $1,044/sq ft (all of 30A: houses $625/sq ft and condos $917/sq ft).
Median price per square foot by type of home, last 12 months. Types with fewer than 10 sales are left out.
Show the numbers
| Type | Sales | Median price | Price per sq ft | All of 30A, per sq ft |
|---|---|---|---|---|
| Houses | 60 | $2.13M | $740/sq ft | $625/sq ft |
| Condos | 11 | $1.3M | $1,044/sq ft | $917/sq ft |
1 of 3: Homes for sale
53 East 30A homes were for sale on September 15, 2026, 5% of all 30A's 993, 20% fewer than a year ago.
Homes for sale on the 15th of each month (not counting homes under contract).
In the 6 months to September 2026, East 30A had 8.3 months of supply, a buyer's market; all of 30A had 7.5.
- East 30A
- All of 30A
Homes for sale divided by the average homes sold per month over the past year. Under 4 months favors sellers; over 6 favors buyers. Gray: all of 30A. Each month pools its sales with the five months before; gaps had fewer than 10 sales.
63 homes sold on East 30A in 2025, against 135 in 2020 (5.0% of 30A's 1,262).
Homes sold each year (houses, condos and townhomes). * The year so far.
Show the numbers
| Year | Sales | Median price | Price per sq ft | Days to contract | Of asking price |
|---|---|---|---|---|---|
| 2017 | 70 | $653K | $355/sq ft | 90 | 95.6% |
| 2018 | 78 | $623K | $343/sq ft | 108 | 96.6% |
| 2019 | 73 | $730K | $369/sq ft | 72 | 97.4% |
| 2020 | 135 | $816K | $420/sq ft | 82 | 96.4% |
| 2021 | 135 | $1.2M | $637/sq ft | 10 | 98.8% |
| 2022 | 70 | $1.52M | $751/sq ft | 37 | 96.7% |
| 2023 | 67 | $1.45M | $834/sq ft | 74 | 94.1% |
| 2024 | 60 | $1.55M | $761/sq ft | 102 | 95.9% |
| 2025 | 63 | $1.51M | $761/sq ft | 113 | 94.8% |
| 2026 so far | 58 | $1.94M | $773/sq ft | 116 | 94.3% |
1 of 2: Days to contract
East 30A homes took a median 91 days to go under contract in the 6 months to September 2026; all of 30A took 80.
- East 30A
- All of 30A
Days from listing to an accepted contract, counting a relisting of the same home within 90 days as one stretch. Gray: all of 30A. Each month pools its sales with the five months before; gaps had fewer than 10 sales.
East 30A homes sold for a median 94.0% of their last asking price in the 6 months to September 2026; all of 30A 96.4%.
- East 30A
- All of 30A
Sale price as a share of the last asking price. Gray: all of 30A. Each month pools its sales with the five months before; gaps had fewer than 10 sales.
1 of 5: Price cuts
About half of the East 30A listings that left the market in 2025 had cut their price; all of 30A: 48%.
Listings that sold, expired or were taken off the market each year, and the share whose last asking price was below their first. Years with fewer than 10 are left blank.
Show the numbers
| Year off the market | Listings | Cut their price | Share | Typical cut |
|---|---|---|---|---|
| 2017 | 105 | 45 | 42.9% | 5.3% |
| 2018 | 126 | 61 | 48.4% | 5.2% |
| 2019 | 128 | 57 | 44.5% | 4.0% |
| 2020 | 192 | 66 | 34.4% | 6.1% |
| 2021 | 162 | 27 | 16.7% | 4.8% |
| 2022 | 108 | 44 | 40.7% | 7.9% |
| 2023 | 120 | 63 | 52.5% | 7.9% |
| 2024 | 131 | 46 | 35.1% | 7.2% |
| 2025 | 140 | 66 | 47.1% | 7.6% |
About half of the East 30A homes put on the market in 2024 hadn't sold a year later; all of 30A: 53%.
Homes put on the market each year that hadn't sold within 12 months (a home relisted the same year counts once). Years with fewer than 10 are left blank.
Show the numbers
| Year listed | Homes listed | Not sold within a year | Share |
|---|---|---|---|
| 2017 | 100 | 38 | 38.0% |
| 2018 | 117 | 54 | 46.2% |
| 2019 | 133 | 55 | 41.4% |
| 2020 | 133 | 23 | 17.3% |
| 2021 | 153 | 18 | 11.8% |
| 2022 | 104 | 43 | 41.3% |
| 2023 | 113 | 33 | 29.2% |
| 2024 | 108 | 55 | 50.9% |
About half of the East 30A resale homes listed in 2025 were vacation rentals when they came on the market; all of 30A: 49%.
Resale homes listed each year that the MLS lists as vacation rentals when they came on the market. Years with fewer than 10 are left blank.
Show the numbers
| Year listed | Resale listings | Vacation rentals | Share |
|---|---|---|---|
| 2017 | 87 | 30 | 34.5% |
| 2018 | 114 | 44 | 38.6% |
| 2019 | 128 | 49 | 38.3% |
| 2020 | 110 | 37 | 33.6% |
| 2021 | 159 | 71 | 44.7% |
| 2022 | 114 | 47 | 41.2% |
| 2023 | 111 | 48 | 43.2% |
| 2024 | 116 | 49 | 42.2% |
| 2025 | 132 | 68 | 51.5% |
East 30A homes listed in December went under contract fastest, a typical 16 days; across all of 30A, December listings were fastest (34 days).
Homes listed in each month since 2017 that later sold, all years together: the typical days to an accepted contract. Months with fewer than 10 sales are left blank.
Show the numbers
| Month listed | Sold | Typical days to contract | Of first asking price |
|---|---|---|---|
| January | 74 | 72 | 96.5% |
| February | 80 | 57 | 95.2% |
| March | 80 | 64 | 93.4% |
| April | 61 | 52 | 96.6% |
| May | 79 | 57 | 94.2% |
| June | 81 | 46 | 94.1% |
| July | 83 | 107 | 95.2% |
| August | 46 | 33 | 94.9% |
| September | 59 | 75 | 94.6% |
| October | 48 | 61 | 94.3% |
| November | 44 | 88 | 93.8% |
| December | 43 | 16 | 97.0% |
East 30A buyers from 2021–23 who paid $1M–$2M and have resold since came out −1.6% after selling costs; all of 30A at that price: −4.0%.
Homes bought between October 2021 and October 2023 and sold again since: the typical change from what the buyer paid, after about 7% in selling costs. Distress sales and rebuilt homes are left out; price bands with fewer than 10 resales are left blank.
Show the numbers
| Price paid | Buyers | Resold | Sold for more | Sold for less | After 7% selling costs |
|---|---|---|---|---|---|
| Under $1M | 28 | 6 | 5 | 1 | – |
| $1M-$2M | 65 | 14 | 12 | 2 | -1.6% |
| $2M-$3M | 20 | 5 | 3 | 2 | – |
| $3M-$4M | 12 | 1 | 1 | 0 | – |
| $4M-$5M | 6 | 0 | 0 | 0 | – |
| Over $5M | 13 | 1 | 1 | 0 | – |
From Garett's blog
Mountainfilm on Tour Returns to WaterColor Nov. 6 and 7
The 26th annual Mountainfilm on Tour screens outdoors at WaterColor Marina Park Amphitheater this Friday and Saturday, Nov. 6 and 7.
30A Homes Took About 109 Days to Sell Over the Last Six Months
From May 8 to November 3, 2026, homes and lots on 30A took 109 days on average to sell. Here's what that pace means for owners and buyers.
What's happening on 30A this week
A busy first week of November on 30A: a BBQ festival, a wine weekend in Seaside, outdoor films, an arts festival, a ranger hike and an early look at December.